Economics
demand and supply

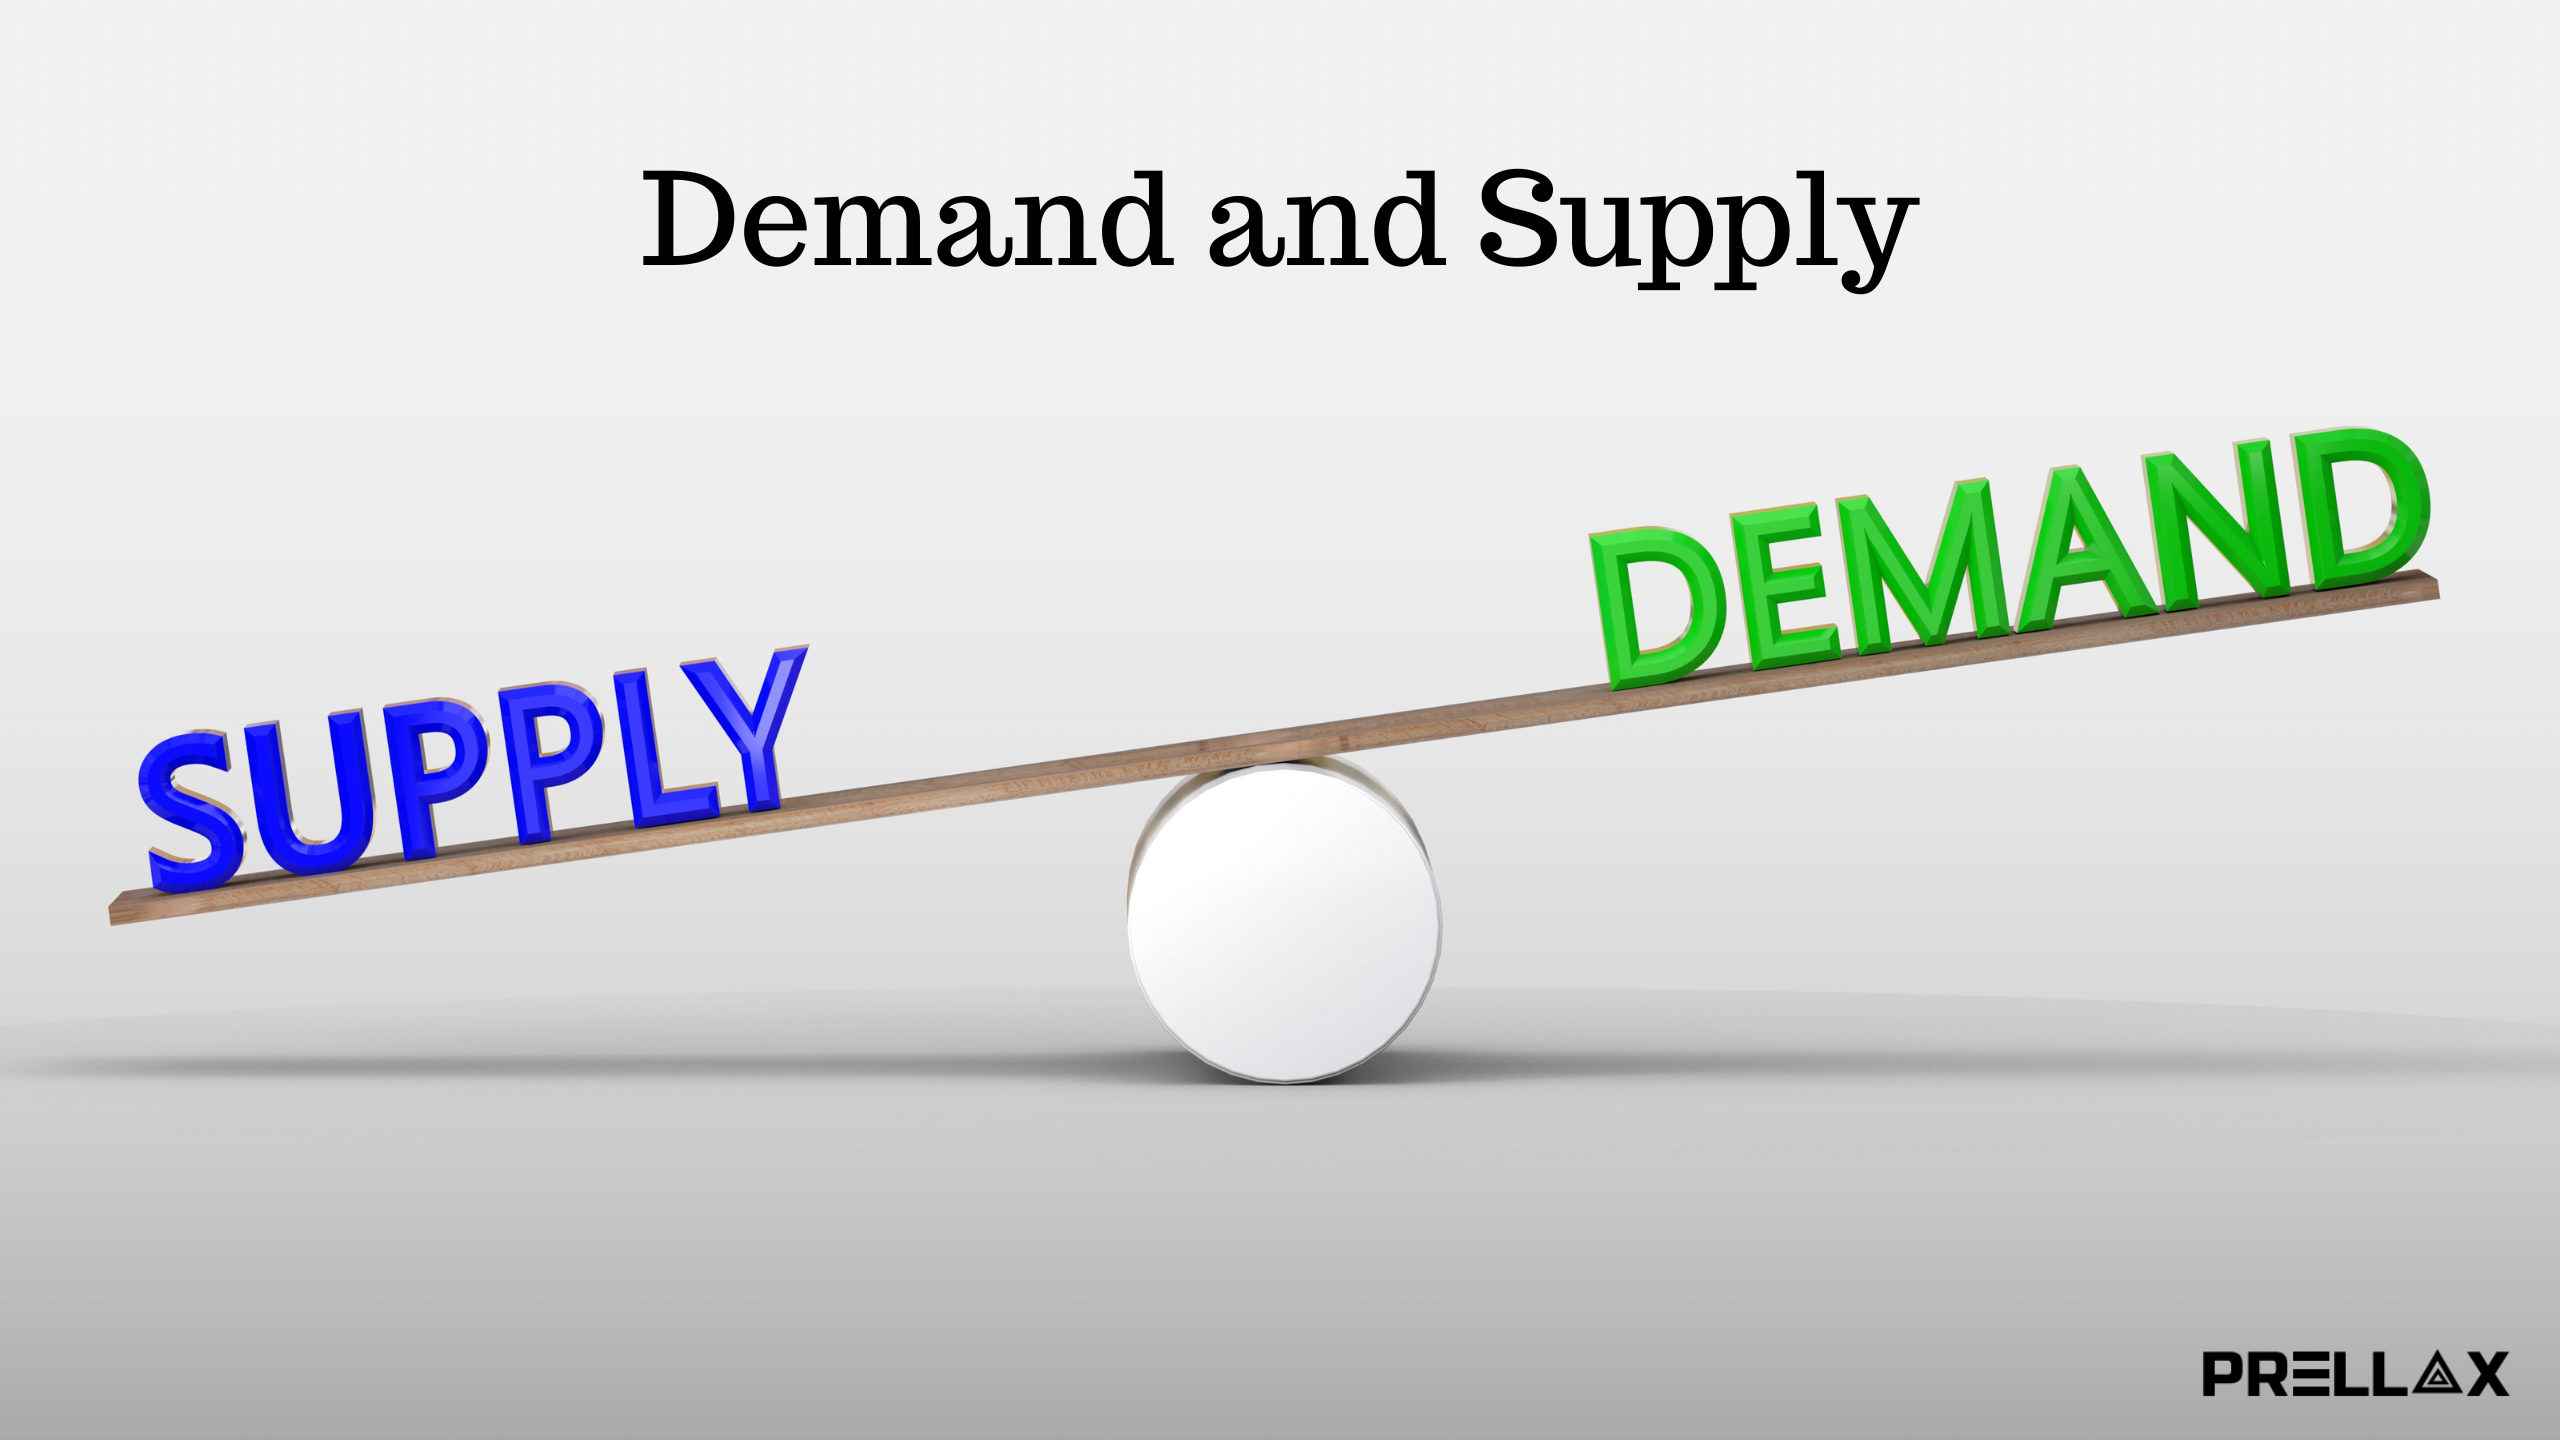
Demand and supply are one of the foundational concepts of economics that explains how the market works. This is a concept that happens in your everyday life as long as you are a consumer or a seller.

A real-life example of demand and supply is Taylor Swift and her new tour. The demand from people who wanted to attend the concert was higher than the number of available tickets, so secondary sellers who saw the dilemma took advantage of it and sold one ticket for as much as 10,000.  <!-- /wp:paragraph -->  <!-- wp:paragraph --> If Taylor Swift hadn't been so popular, she might have had to lower her ticket prices and reduce the capacity of concert venues because that's what economics is all about.  <!-- /wp:paragraph -->  <!-- wp:paragraph --> The market operates on a demand and supply model; if there is no demand for your goods and services, then there won't be a supply because you can't sell what people don't want to buy. This is why we have the <strong>law of demand and supply.</strong> <!-- /wp:paragraph -->  <!-- wp:image --> <figure class="wp-block-image"><img src="https://lh6.googleusercontent.com/fD-petdRU-oYDkIFRK4g7h6c4vf0nofyArpWcmTQWhxSOiOK9AtsknWB0Nx5g4MBrlmpHyn7HGAqWcPiYkMxf9fyyyUYonf01JgOfXb-_m6NgrHG5aAwXL1ydzgBn1yj84s6vrfWfSmFpPshTKlLbg" alt="demand and supply graph"/></figure> <!-- /wp:image -->  <!-- wp:paragraph -->                                                                                  Demand and Supply Graph <!-- /wp:paragraph -->  <!-- wp:paragraph -->  <!-- /wp:paragraph -->  <!-- wp:heading {"level":4} --> <h4 class="wp-block-heading">The Law of Demand and Supply</h4> <!-- /wp:heading -->  <!-- wp:paragraph --> The law of demand and supply states that prices are determined by how much people want something and how much is available. If there is more demand for something than there is supply, the price will rise. If there is more supply of something than is wanted, the price will go down. <!-- /wp:paragraph -->  <!-- wp:paragraph --> The law of demand and supply explains how the relationship between demand and supply affects prices.  <!-- /wp:paragraph -->  <!-- wp:heading {"level":5} --> <h5 class="wp-block-heading">The Law of Demand</h5> <!-- /wp:heading -->  <!-- wp:paragraph --> The law of demand states that as prices rise for a product, the demand for said product will also decrease. Subsequently, when prices drop for the product, demand for the product increases when the supply of the product exceeds the demand. <!-- /wp:paragraph -->  <!-- wp:heading {"level":6} --> <h6 class="wp-block-heading">An Example of The Law of Demand</h6> <!-- /wp:heading -->  <!-- wp:paragraph --> The iPhone 14 was said to be the worst-selling iPhone in years. Most of the complaints were about the price; most buyers felt it was not worth it and didn't live up to the expectations they had. When a price is set high, the demand naturally fizzles out. <!-- /wp:paragraph -->  <!-- wp:paragraph --> This economic relationship is usually represented by a downward-sloping demand curve. <!-- /wp:paragraph -->  <!-- wp:heading {"level":5} --> <h5 class="wp-block-heading">Demand Curve</h5> <!-- /wp:heading -->  <!-- wp:image --> <figure class="wp-block-image"><img src="https://lh3.googleusercontent.com/DBePxlaN9r-MoqVyb5oakteQFlEFTiStgNJyOJoEHjrou7tBHylq5UjlFWqFZZCEf0xRCDcchk4YFPeoIZokUuRNwVMN80Kke3qNdzY4z_p75VWatEeBpoizecUVITvxGixniwUq73XQrnVsT-SCHw" alt="demand curve"/></figure> <!-- /wp:image -->  <!-- wp:paragraph -->                                                                  Figure showing the demand curve. <!-- /wp:paragraph -->  <!-- wp:paragraph -->  <!-- /wp:paragraph -->  <!-- wp:paragraph --> A demand curve is a graph that illustrates how changes in price affect demand. It serves as a graphic representation of the law of demand. The demand curve can also be used to show the relationship between price and quantity for consumers in a market. <!-- /wp:paragraph -->  <!-- wp:paragraph --> Companies and businesses can benefit from using the demand curve since it can show them the prices at which customers start buying more or less. <!-- /wp:paragraph -->  <!-- wp:paragraph --> We have two types of demand curves, which are <strong>elasticity</strong> and <strong>in-elasticity</strong> demand curves.  <!-- /wp:paragraph -->  <!-- wp:paragraph --> <strong>Elastic demand</strong>: This happens when a change in price causes a big shift in demand for the product. A product is said to be elastic if a change in price causes a significant shift in demand. The more readily available substitutes there are, the more elastic the product will be.  <!-- /wp:paragraph -->  <!-- wp:paragraph --> For example, a change in the price of jewellery can cause demand to either fall or rise. Examples of elastic products include snacks, certain types of foods, clothing, electronics, and others. <!-- /wp:paragraph -->  <!-- wp:paragraph --> <strong>In-elastic demand: </strong>This happens when a price change doesn't affect the demand for a product or service. Examples of inelastic products include utilities and prescription drug medication, among others. <!-- /wp:paragraph -->  <!-- wp:heading {"level":5} --> <h5 class="wp-block-heading">Demand Analysis</h5> <!-- /wp:heading -->  <!-- wp:paragraph --> Demand analysis is done when companies want to understand consumer demand for a certain product. They perform demand analysis research to help them understand what the consumers want and how they can satisfy that want with their product.  <!-- /wp:paragraph -->  <!-- wp:paragraph --> Companies typically use demand analysis to determine their target market, collect and analyze data, and identify factors that affect consumer behaviour. <!-- /wp:paragraph -->  <!-- wp:heading {"level":4} --> <h4 class="wp-block-heading">The Law of Supply</h4> <!-- /wp:heading -->  <!-- wp:paragraph --> The law of supply states that as prices increase for a product, the supply of said product also increases. Subsequently, the fall in prices leads to a fall in supply.  <!-- /wp:paragraph -->  <!-- wp:paragraph --> This is in contrast to what the law of demand states, because when the prices are high, the suppliers earn more, so they, therefore, push more products onto the market. <!-- /wp:paragraph -->  <!-- wp:heading {"level":5} --> <h5 class="wp-block-heading">An Example of The Law of Supply</h5> <!-- /wp:heading -->  <!-- wp:paragraph --> If a local shop owner sells blue shirts and a famous singer posts the same shirt on her Instagram page, which makes the shirt the hottest-selling shirt in the country and leads to its price rising from10 to $40, you will naturally go to your storage and warehouse and try and sell as many shirts as possible.
This economic relationship is usually represented by an upward-sloping supply curve.

Supply Curve
supply curve

Figure showing the supply curve.

A supply curve is a graph that illustrates how a change in the price of a good or service impacts the quantity a seller supplies. The vertical y-axis displays the price, while the horizontal x-axis displays the quantity given.

Supply Analysis

This is when producers try to understand the market and the changes that happen in it. It’s a scenario where producers and companies study the market to know how much of their goods and services can be sold at different prices. 

Supply analysis involves identifying the industry through the collection and analysis of data to estimate and forecast the supply. Supply analysis is important for businesses in creating market strategies and identifying business expansion.

Equilibrium (Demand and Supply)

Equilibrium in demand and supply

I’m sure after reading through the laws and the concept of demand and supply, you’ll probably be thinking, “Is there no middle ground?” Well, let me introduce you to equilibrium.

Equilibrium in economics is a state in the market that happens when there is just enough supply and demand for goods and services, which leads the prices to stay the same. 

When there is too much supply or too little demand, prices can change, but equilibrium is the middle ground. This is a market state where both sellers and buyers agree.

When the economy is not at equilibrium, it is said to be in disequilibrium.

Type of Equilibrium

There are different types of equilibrium.

  • Economic equilibrium: This is the most common type of equilibrium and refers to a state in the economy where the market is balanced. This can be seen in a market where supply is equal to demand.
  • Nash equilibrium: This is a game-concept theory used to analyze multiple players’ strategies and behaviours. This equilibrium theory was named after John Nash, a mathematician from the United States. It is a game theory that tries to figure out mathematically and logically what players should do in a game to get the best results for themselves.
  • General equilibrium: General equilibrium focuses on the economy instead of analyzing only single markets. A market could be said to have achieved general equilibrium when all the markets are simultaneously at equilibrium.

Key points

  • All things being equal, if prices for a product or service increase, demand will fall, as stated in the law of demand.
  • While for supply, an increase in price for a product or service will lead to a rise in supply.
  • Equilibrium is the balance between demand and supply in the market.

FAQ

Q. What is Demand and Supply?

Ans: Demand and supply is an economic concept that explains how the market works and how the market reacts to buyers and sellers.

Q. What are demand and supply with examples?

Ans: One of the most obvious examples of demand and supply in our generation is the rise in the purchase of Christmas songs in November and December. 

People are willing to purchase songs and accessories during the festive periods, which leads to a demand for the songs and goods and leads to an increase in the price of those goods, which now leads to an increase in supply.

Q. What defines demand and supply?

Ans: Consumer and producer behavior defines demand and supply. Their behaviors on how much they are willing to pay for goods and services and how much they are willing to sell goods and services define demand and supply.

Q. What are the types of demand?

Ans: There are different types of demand, here are five of the main types of demand.

  • Market demand.
  • Individual demand.
  • Cross demand
  • Composite demand.
  • Joint demand.

Take a quick quiz.

1. When prices go up and the demand falls, what is this behaviour called?

  1. Law of supply
  2. Law of demand
  3. Law of equilibrium

2. Which is represented by a downward slope curve?

  1. Demand 
  2. Supply 
  3. The Law

3. Which of these is not a factor that affects supply?

  1. Government
  2. Price 
  3. Automobile

Leave a Reply

Your email address will not be published. Required fields are marked *

en_USEnglish